Microsoft Sentinel Detection Lab
- Jv Cyberguard

- Oct 14, 2024
- 11 min read
Welcome to the Microsoft Sentinel and Honey pot detection lab. Please note that this lab includes troubleshooting steps I had to do along the way, I will indicate the troubleshooting sections and you can either work through them with me or go ahead to the problem solved section. If you follow my steps in the troubleshooting section, you will make mistakes like I did, but you will also learn from them!

In this lab we are going to accomplish these 4 objectives:
▪ Use PowerShell to create custom logs by extracting metadata from Event Viewer and forwarding it to a Geolocation API.
▪ Configured Log Analytics Workspace in Azure to ingest logs from Vulnerable public-facing Windows 10 VM.
▪ Leverage the Azure Monitoring Agent and features such as ingestion-time transformation(essentially parsing the data as its collected) for parsing the incoming data stream.
▪ We also show another method of completing this lab where we parse the data at query time (after it has been collected).
▪ Configured Azure Sentinel workbook using KQL to display attack data (RDP brute force) on world map.
We will break this project into 2 parts.
Architecting the environment and deploying machines.
Configuring data flows & Integrating Microsoft Sentinel SIEM
1. Architecting the environment and deploying machines.
First steps we have to get our Azure account created. Azure gives a $200 credit that will come in handy, just ensure you delete the resource group containing all our resources after the fact.
Next Thing we have to do is create the virtual machine. We may first be prompted to create a resource group which is essentially a collection of resources that are grouped by some common function or attributes. Follow the other configurations listed in the following image.
Scroll down. Here we will now configure the size of the machine, etc. I chose Standard B1 initially, but it isn't sufficient, so I would advise you to select Standard D2s v3. Enter your local account credentials, you will need them to access the machine.
Navigate to the networking tab by clicking next twice.Remember the goal is to make the machine as vulnerable as possible so we will edit the Network Security Group(NSG) which in Azure is essentially our firewall. To do this change the radio from NIC NSG from Basic to Advanced and then we will allow anything.
We will delete the rule that exists and then create our own.
After we save the config, Review + Create. This is the cost. Remember to delete the Resource group after the fact so that you have enough credit left over. It will be more if you choose the upgraded size like I mentioned above.
You should see this screen if deployment is in progress.
Next step is to create the Log Analytics work space(LAW). According to Microsoft, a log analytics work space is a data store into which can collect any type of log data from all of your Azure non-Azure resources and applications. So once our logs are in here we can then connect Sentinel to it as well as the VM. Search Log Analytics Workspace in the search to the top within Azure. Then create.
For the config, choose the same resource group we created. The instance name could be whatever you like. Then review+ create.
The next step now the LAW is created, is to navigate to Defender for Cloud which is an additional security best practice for detections on the virtual machines.
Turn on Defender logging for machines and then Save. We will then go to Data Collection and choose ALL which defines the types of logs we want to collect.
We now need to connect our Virtual machine VM to our Log Analytics Workspace.
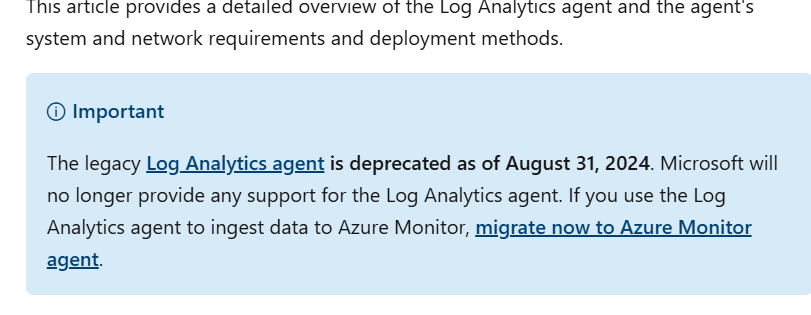
The last time I did this project we installed the log analytics agent, however according to Microsoft Docs it is now deprecated.
So the following steps we will use the Azure monitoring agent to achieve the same end goal. To do this we could either go to Data Collection Rules directly or if we clicked on Azure VMs under 'Connect a Data source' in the Get Started section, that will also install the Azure Monitoring Agent on our VM.
If we want to verify quickly first that the Azure Monitoring Agent is not installed we can Navigate to the virtual machine in Settings select. Extensions + Applications.
We confirmed it's not there so we will go ahead and create the Data collection rule inside the LAW.
Add the VM.
Then add the data sources we want to collect which are event logs.
Finally, we will configure the destination. Then Review + Create. These are just winevent logs we are ingesting to Log Analytics Workspace, it's good to have other logs being ingested so we can better troubleshoot an isolate issues with our custom logs if they arise.
If we check The VM's Extensions+ Applications we now see the Agent deployed and the processes running on the machine and running Get-Process on the Windows 10 VM also shows the process associated with the Azure Monitoring Agent (AMA).
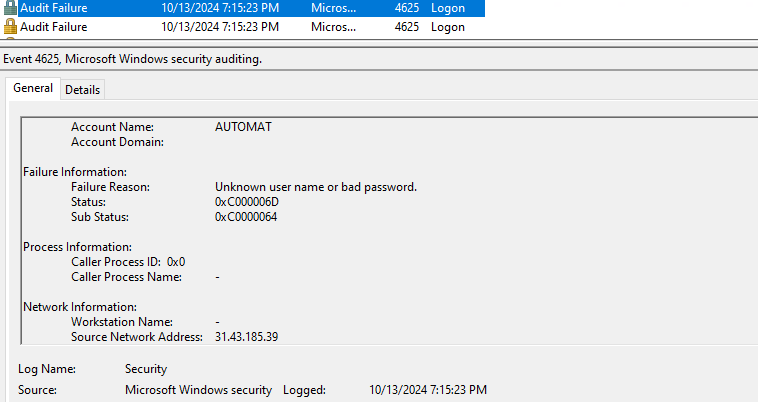
Now, our machine is already being hit by brute force attacks and this is the data that we want to ingest to our Log Analytics Work Space and also see in our Sentinel SIEM . I can show you an example from the multitude of logs. Navigate to Event Viewer > Windows Logs > Security Logs > try to find Event ID 4625.
If we use a reputation check tool like ipvoid.com we would see the failed logon was from the Netherlands. I live nowhere near there.
Ok before we get to the fun stuff, we have to make sure we finish building our all the connections in our initial diagram. Therefore, let us quickly connect Sentinel to our Log Analytics Workspace. Click Create
Then add it to our Workspace. It should tell you that your Sentinel Free trial is activated.
Now back to the Virtual Machine. The next thing we want to do is make sure this machine is susceptible to all methods of asset discovery. Let's try pinging the VM from our local host to see if it sends ICMP replies.
It is timing out. We will turn off the firewall to see if that changes things.
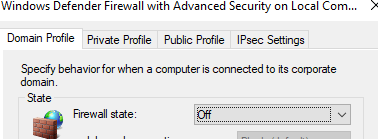
We will turn it off the VM's firewall and see if it starts to reply.
It was still timing out so I tried going in Windows settings and turned off Public Network protection. That is what worked.
2. Configuring data flows & Integrating Microsoft Sentinel SIEM
The goal will be using a PS script that connects to the GeoLocation API, then taking the longitude and latitude data to enrich our custom winevent audit failure logs and ingesting it into Sentinel where we will be able to display all this on the world map.
You will need to sign up and get your own API key from the website. It will be in dashboard. Replace the API key in the header variable inside the script with yours.
Once we run the script what we can do is try to log on with an incorrect password, to see if it records the attempt.
One thing I observed was that it took like 15-30 mins before the logs started to show up. I am unsure where the bottleneck is at this point. But here are the logs below. It is possible it was the VM size I had initially. Here is a snipped of the attempts.
The data is stored in this directory as a text file.
To make this work seamless we need to modify the PowerShell script, currently it prints the field name to the logs but we only want values, we will be transforming the data outside of PowerShell. In the 3rd line, remove the field name so only the value is printed. Remove everything before each dollar sign.
Before
After ( I pasted what it should
"$($latitude),$($longitude),$($destinationHost),$($username),$($sourceIp),$($state_prov),$($country),$($country) - $($sourceIp),$($timestamp)" | Out-File $LOGFILE_PATH -Append -Encoding utf8
I adjusted it so that what is written to the log does not include the field name, just the values.
Stop and Start your script if you have to. Do you see the difference?
Next, we need to create a custom log table in our Log Analytics work space so that we can ingest these custom logs from our Honeypot VM. Before we do this though, in order to allow the custom log txt file to be ingested into Log Analytics Work Space we have to create a Data collection endpoint. A data collection endpoint (DCE) is a connection where data sources send collected data for processing and ingestion into Azure Monitor/Log Analytics Work Space. This Microsoft Doc tells us why DCE is required. https://learn.microsoft.com/en-us/azure/azure-monitor/essentials/data-collection-endpoint-overview?tabs=portal
Now we can create that custom log source. Navigate to your Log Analytics Work space in Azure > Settings > Tables > Create > New Custom log DCR based.
We will need to create a new data collection rule for this log. Create a table name. Description. Select the Data Collection Endpoint we just created. Then finally, create a new data collection rule.
In Schema and Transformation tab we now have to upload a log sample but they want it in JSON.
What we will do next is to convert the log to JSON format. This Microsoft Doc gave a JSON template that we can populate with three instances of our logs but I tailored it to our lab below. https://learn.microsoft.com/en-us/azure/azure-monitor/logs/create-custom-table?tabs=azure-portal-1%2Cazure-portal-2%2Cazure-portal-3#prerequisites
Save this in notepad as a json file then upload it.
[ { "latitude": 47.91542, "longitude": -120.60306, "destinationhost": "samplehost", "username": "fakeuser", "sourcehost": "24.16.97.222", "state": "Washington", "country": "United States", "label": "United States - 24.16.97.222", "timestamp": "2014-11-08 15:55:55" }, { "latitude": -22.90906, "longitude": -47.06455, "destinationhost": "samplehost", "username": "lnwbaq", "sourcehost": "20.195.228.49", "state": "Sao Paulo", "country": "Brazil", "label": "Brazil - 20.195.228.49", "timestamp": "2014-11-08 15:55:55" }, { "latitude": 52.37022, "longitude": 4.89517, "destinationhost": "samplehost", "username": "CSNYDER", "sourcehost": "89.248.165.74", "state": "North Holland", "country": "Netherlands", "label": "Netherlands - 89.248.165.74", "timestamp": "2014-11-08 15:55:55" } ]
To resolve the error that comes up, click on Transformation editor and modify the KQL from source > to the KQL below. It creates another column as time generated based on the timestamp column.
Then Create. It's now in the list.
Now, we have to edit the Data collection rule we just created to add the virtual machine since it wasn't added by default. Type Data Collection Rules in the search and go to the one we created for failed rdp logons. Side note: For more on Data Collection Rules see this link: https://learn.microsoft.com/en-us/azure/azure-monitor/essentials/data-collection-rule-overview
We also need to add the data source for the specific text file and logs contained within to be ingested into the custom table in Log Analytics Workspace. Reference this doc for information on how I knew what to fill here. https://learn.microsoft.com/en-us/azure/azure-monitor/agents/data-collection-log-text?tabs=portal#create-a-data-collection-rule-for-a-text-file .For the source, there is a transformation that parses data in comma delimited log files and separates them into columns. We will be placing that in the source field. The transformation is below. What does this transformation do?
This transformation takes the raw log data (a comma-separated string) and splits it into individual fields like latitude, longitude, destinationhost, username, etc. It then converts the data into appropriate types, such as real for numeric values like latitude and longitude, and string for textual values like the destinationhost and username. Finally, it formats the timestamp into a datetime value and extends the TimeGenerated field to ensure it's compatible with querying.
source | project d = split(RawData,",") | project latitude=toreal(d[0]), longitude=toreal(d[1]), destinationhost=tostring(d[2]),username=tostring(d[3]), sourcehost=tostring(d[4]), state=tostring(d[5]), country=tostring(d[6]), label=tostring(d[7]), timestamp=todatetime(d[8]) | extend TimeGenerated = todatetime(timestamp)
I was stumped after completing because I made an error above with the file pattern. You can fix it now to save you time. I forgot the extension.
We now configure the destination where the extracted logs will be delivered.
I need you to go into Log Analytics Work Space and open tables. Look for the custom log table that we created. To the far right click on the 3 dots and verify that your table schema looks like below with corresponding data types.
Let's see the data in our table now. failedrdp_CL click Run.
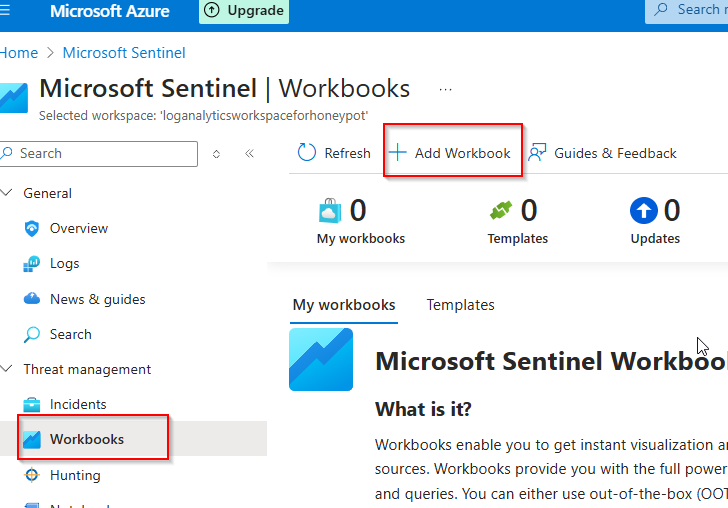
We are not good to wrap this up by going in Sentinel to create our map.
Then click edit.
Remove those 2 tables by clicking the 3 dots.
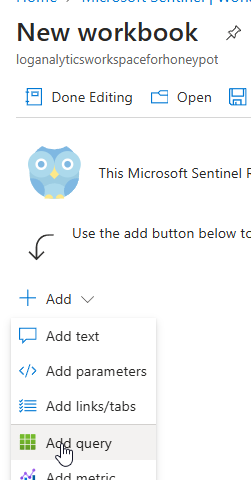
Click Add query.
Enter this query for the workbook. It gets a count of the failed logons and groups them by their source host etc. It makes sure to exclude the sample logs we seeded our custom log file with and any feel where sourcehost is blank.
failedrdp_CL
|summarize event_count=count() by sourcehost, latitude, longitude, country, label, destinationhost
| where destinationhost != "samplehost"
| where sourcehost != ""
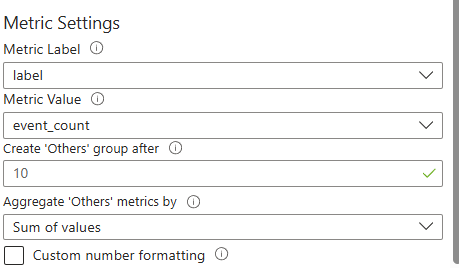
Set visualization to map and change the metric settings
We now have our map.
Set refresh to 5 mins.
Then click the Save icon and call it failed_rdp_map
And you're done.
What are the latency times like for this method? Well definitely a bit slower than the next method I'm about to show you but not painfully slow anymore. The early on spikes were due to some configuration issues I had to resolve.
Method B - Parsing by query after being ingested as raw data.
Now let's say you decided that you do NOT want to the data to be parsed during ingestion but instead you will parse it by querying the raw data after it is already in the custom log table.
How would you achieve this? Well, rather than including the KQL to transform the data in the Data Collection rule you would just write source. Source means it is ingested just as it is written to the log, into the RawData field in the incoming stream.
What would the failed logon logs look like in the table? It will be like the Simple table in the image below. As a troubleshooting tip, you may have to stop and start the script after making the changes to the Data collection rule especially if there is a stop to log ingestion or no change in response to the change in formatting of log ingestion.
Setting the transform field to, 'source', should cause all your values to now be ingested in the RawData column. Allowing us to parse after ingestion rather than before. In the image below you can see what all the parsed out columns that we once had, would now look like.
Latency is also drastically reduced; the latest log is 5 minutes behind at most.
So, we can now parse the data at rest. The advantage is a significant reduction in resource overhead, but the actual custom log table remain unparsed. How do we parse the data to get it back in column form?
You may find these two Microsoft Doc articles helpful in understanding this.
Leveraging this KQL.
failedrdp_CL
| project d = split(RawData, ",")
| project latitude = toreal(d[0]),
longitude = toreal(d[1]),
destinationhost = tostring(d[2]),
username = tostring(d[3]),
sourcehost = tostring(d[4]),
state = tostring(d[5]),
country = tostring(d[6]),
label = tostring(d[7]),
timestamp = todatetime(d[8])
| extend TimeGenerated = todatetime(timestamp)
| project TimeGenerated, latitude, longitude, destinationhost, username, sourcehost, state, country, label, timestamp
How does the KQL transform the data? Well it splits it by the comma delimiter. Each value before the comma is placed in a column from 0 to 8. If you read the docs and looked at the incoming data stream you would realize that we need a TimeGenerated column, so we use extend to create that column and assign it the timestamp value. Then parses the data into columns.
That was for demonstrative purposes but you can also save that query in the event you need to investigate or build detections.
We will now move to Microsoft Sentinel SIEM. With these changes you may have to change the time range.
Then click edit again.
Remove those 2 tables by clicking the 3 dots.
Click Add query and paste this KQL in.
failedrdp_CL
| project d = split(RawData, ",")
| project latitude = toreal(d[0]),
longitude = toreal(d[1]),
destinationhost = tostring(d[2]),
username = tostring(d[3]),
sourcehost = tostring(d[4]),
state = tostring(d[5]),
country = tostring(d[6]),
label = tostring(d[7]),
timestamp = todatetime(d[8])
| extend TimeGenerated = todatetime(timestamp)
| project TimeGenerated, latitude, longitude, destinationhost, username, sourcehost, state, country, label, timestamp
| summarize event_count=count() by sourcehost, latitude, longitude, country, label, destinationhost
| where destinationhost != "samplehost"
| where sourcehost != "")
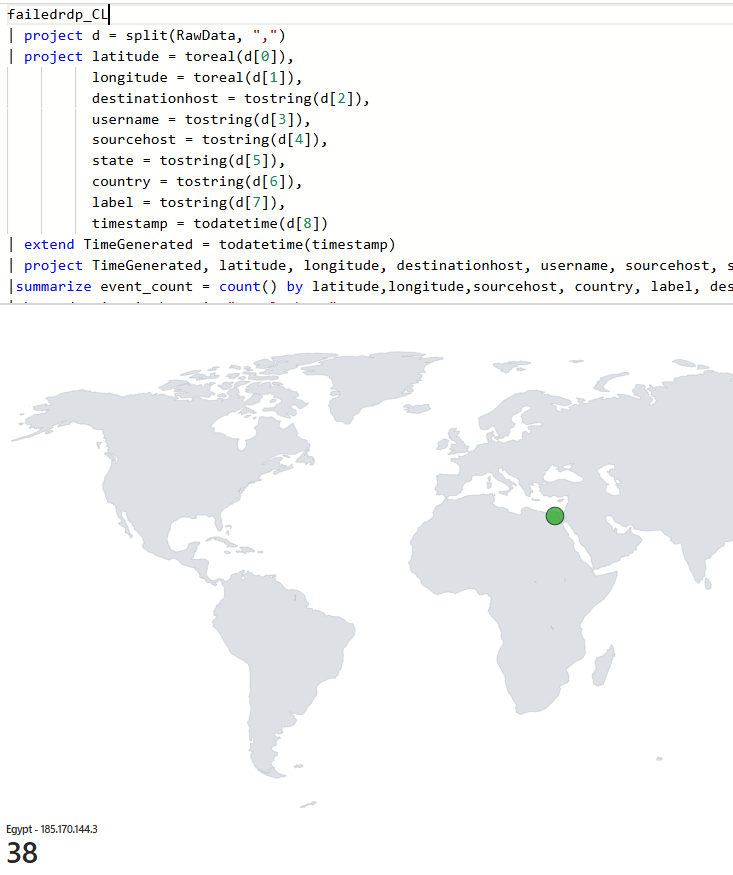
This will be the output.
Change the visualization to Map.
Then do the final steps like we did in the other like changing metrics settings.
You now have completed the same lab parsing using KQL rather than performing transformation during ingestion. The failedrdp_CL table will still be in the raw log stage but through parsing with queries we were able to achieve the same end result.
Until Next Time!















Comments